直方图#
%matplotlib inline
import matplotlib.pyplot as plt
import numpy as np
# matplotlib加入中文支持
plt.rcParams['font.sans-serif'] = ['Arial Unicode MS']
基本直方图#
x = np.random.randn(1000)
bins:📊条数
alpha:透明度
color:颜色
density:面积是否归为1
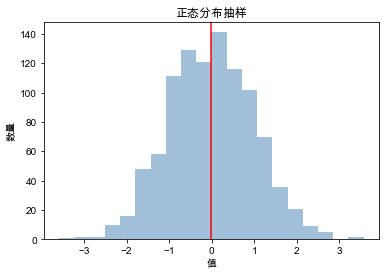
plt.hist(x, bins=20, alpha=0.5, color='steelblue', density=False)
# axvline插入竖线
plt.axvline(np.mean(x), c='red')
plt.xlabel("值")
plt.ylabel("数量")
plt.title("正态分布抽样")
plt.show()
多个hist组合#
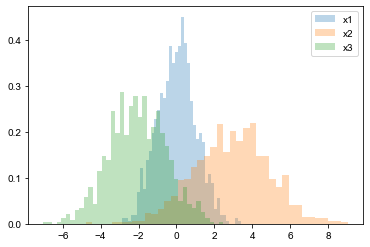
x1 = np.random.normal(0, 1, 1000)
x2 = np.random.normal(3, 2, 1000)
x3 = np.random.normal(-2, 1.5, 1000)

# 由kwargs表示hist参数,不必配置color,会自动区分开
kwargs = dict(bins=40, alpha=0.3, density=True)

plt.hist(x1, **kwargs, label="x1")
plt.hist(x2, **kwargs, label="x2")
plt.hist(x3, **kwargs, label="x3")
plt.legend()
plt.show()
各种plt风格#
plt.style.available
['Solarize_Light2',
 '_classic_test_patch',
 '_mpl-gallery',
 '_mpl-gallery-nogrid',
 'bmh',
 'classic',
 'dark_background',
 'fast',
 'fivethirtyeight',
 'ggplot',
 'grayscale',
 'seaborn',
 'seaborn-bright',
 'seaborn-colorblind',
 'seaborn-dark',
 'seaborn-dark-palette',
 'seaborn-darkgrid',
 'seaborn-deep',
 'seaborn-muted',
 'seaborn-notebook',
 'seaborn-paper',
 'seaborn-pastel',
 'seaborn-poster',
 'seaborn-talk',
 'seaborn-ticks',
 'seaborn-white',
 'seaborn-whitegrid',
 'tableau-colorblind10']
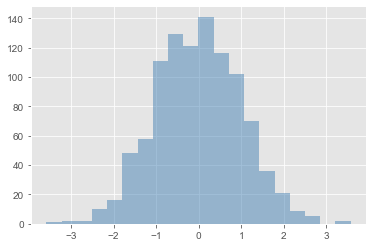
with plt.style.context("ggplot"):
    plt.hist(x, bins=20, alpha=0.5, density=False, color='steelblue')
seaborn直方图及kde#
import seaborn as sns
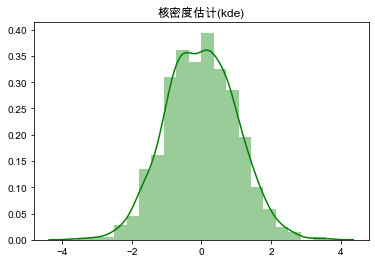
displot融合了直方图和kde,它没有alpha和density参数
sns.distplot(x, bins=20, color='green')
plt.title("核密度估计(kde)")
plt.show()
kdeplot只展示kde
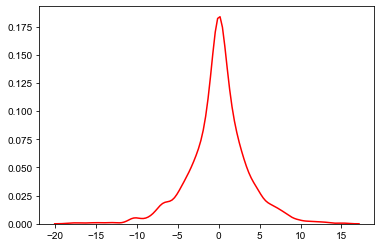
sns.kdeplot(x1*x2, color='red')
plt.show()
