饼图#
%matplotlib inline
import matplotlib.pyplot as plt
import numpy as np
# matplotlib加入中文支持
plt.rcParams['font.sans-serif'] = ['Arial Unicode MS']
"""
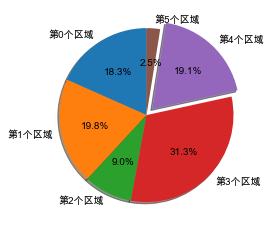
各区域的数量、名字和分离度
"""
numbers = np.random.randint(1, 100, 6)
labels = [f"第{i}个区域" for i in range(6)]
explode = (0, 0, 0, 0, 0.1, 0)
labels: 名字
explode: 分离度
autopct: 数量显示格式
shadow: 是否画阴影
startangle: 起始角度
plt.pie(numbers, labels=labels, explode=explode, autopct="%1.1f%%", shadow=True, startangle=90)
plt.show()